How Much Does Your Load Carrier Status Quo Really Cost You

The hidden cost-driver
Imagine you had an employee who secretly stole money from the cash register every day. Not much – just a little bit each day. Nobody complains because nobody notices exactly what’s happening. It just goes on like this until, at the end of the year, someone adds up the numbers and wonders: where on earth has it all gone?
That is exactly what happens in many companies with their pallet pool. Except that the money isn’t missing from the cash register, it’s tied up in working hours spent on account reconciliations and investigations – or on replacement purchases because pallets have gone missing and no one can say exactly where they’ve gone. Both add up. Over months, over years. By the end of the year at the latest, it becomes clear: exchange accounts don’t match up, stock levels differ from reality, and someone on the team has spent quite a lot of time reconciling lists and chasing up partners on the phone.
Very few people know exactly what that amounts to in euros. And that is precisely what we want to change.
Two cost overruns that hardly anyone sees as being linked
At the heart of load carrier management, there are essentially two cost categories – and almost every company has a problem with one of them. Some even have problems with both.
Staff costs: What your team spends every day on booking load carriers, reconciling accounts and correcting errors.
Capital costs: What shrinkage, replenishment purchases and tied-up capital in circulation cost you.
Both factors depend directly on a single parameter: your annual load carrier throughput. The higher the volume, the more both effects are amplified.
The key point is this: if you try to cut costs without understanding both factors, you’ll be optimising in the wrong place.
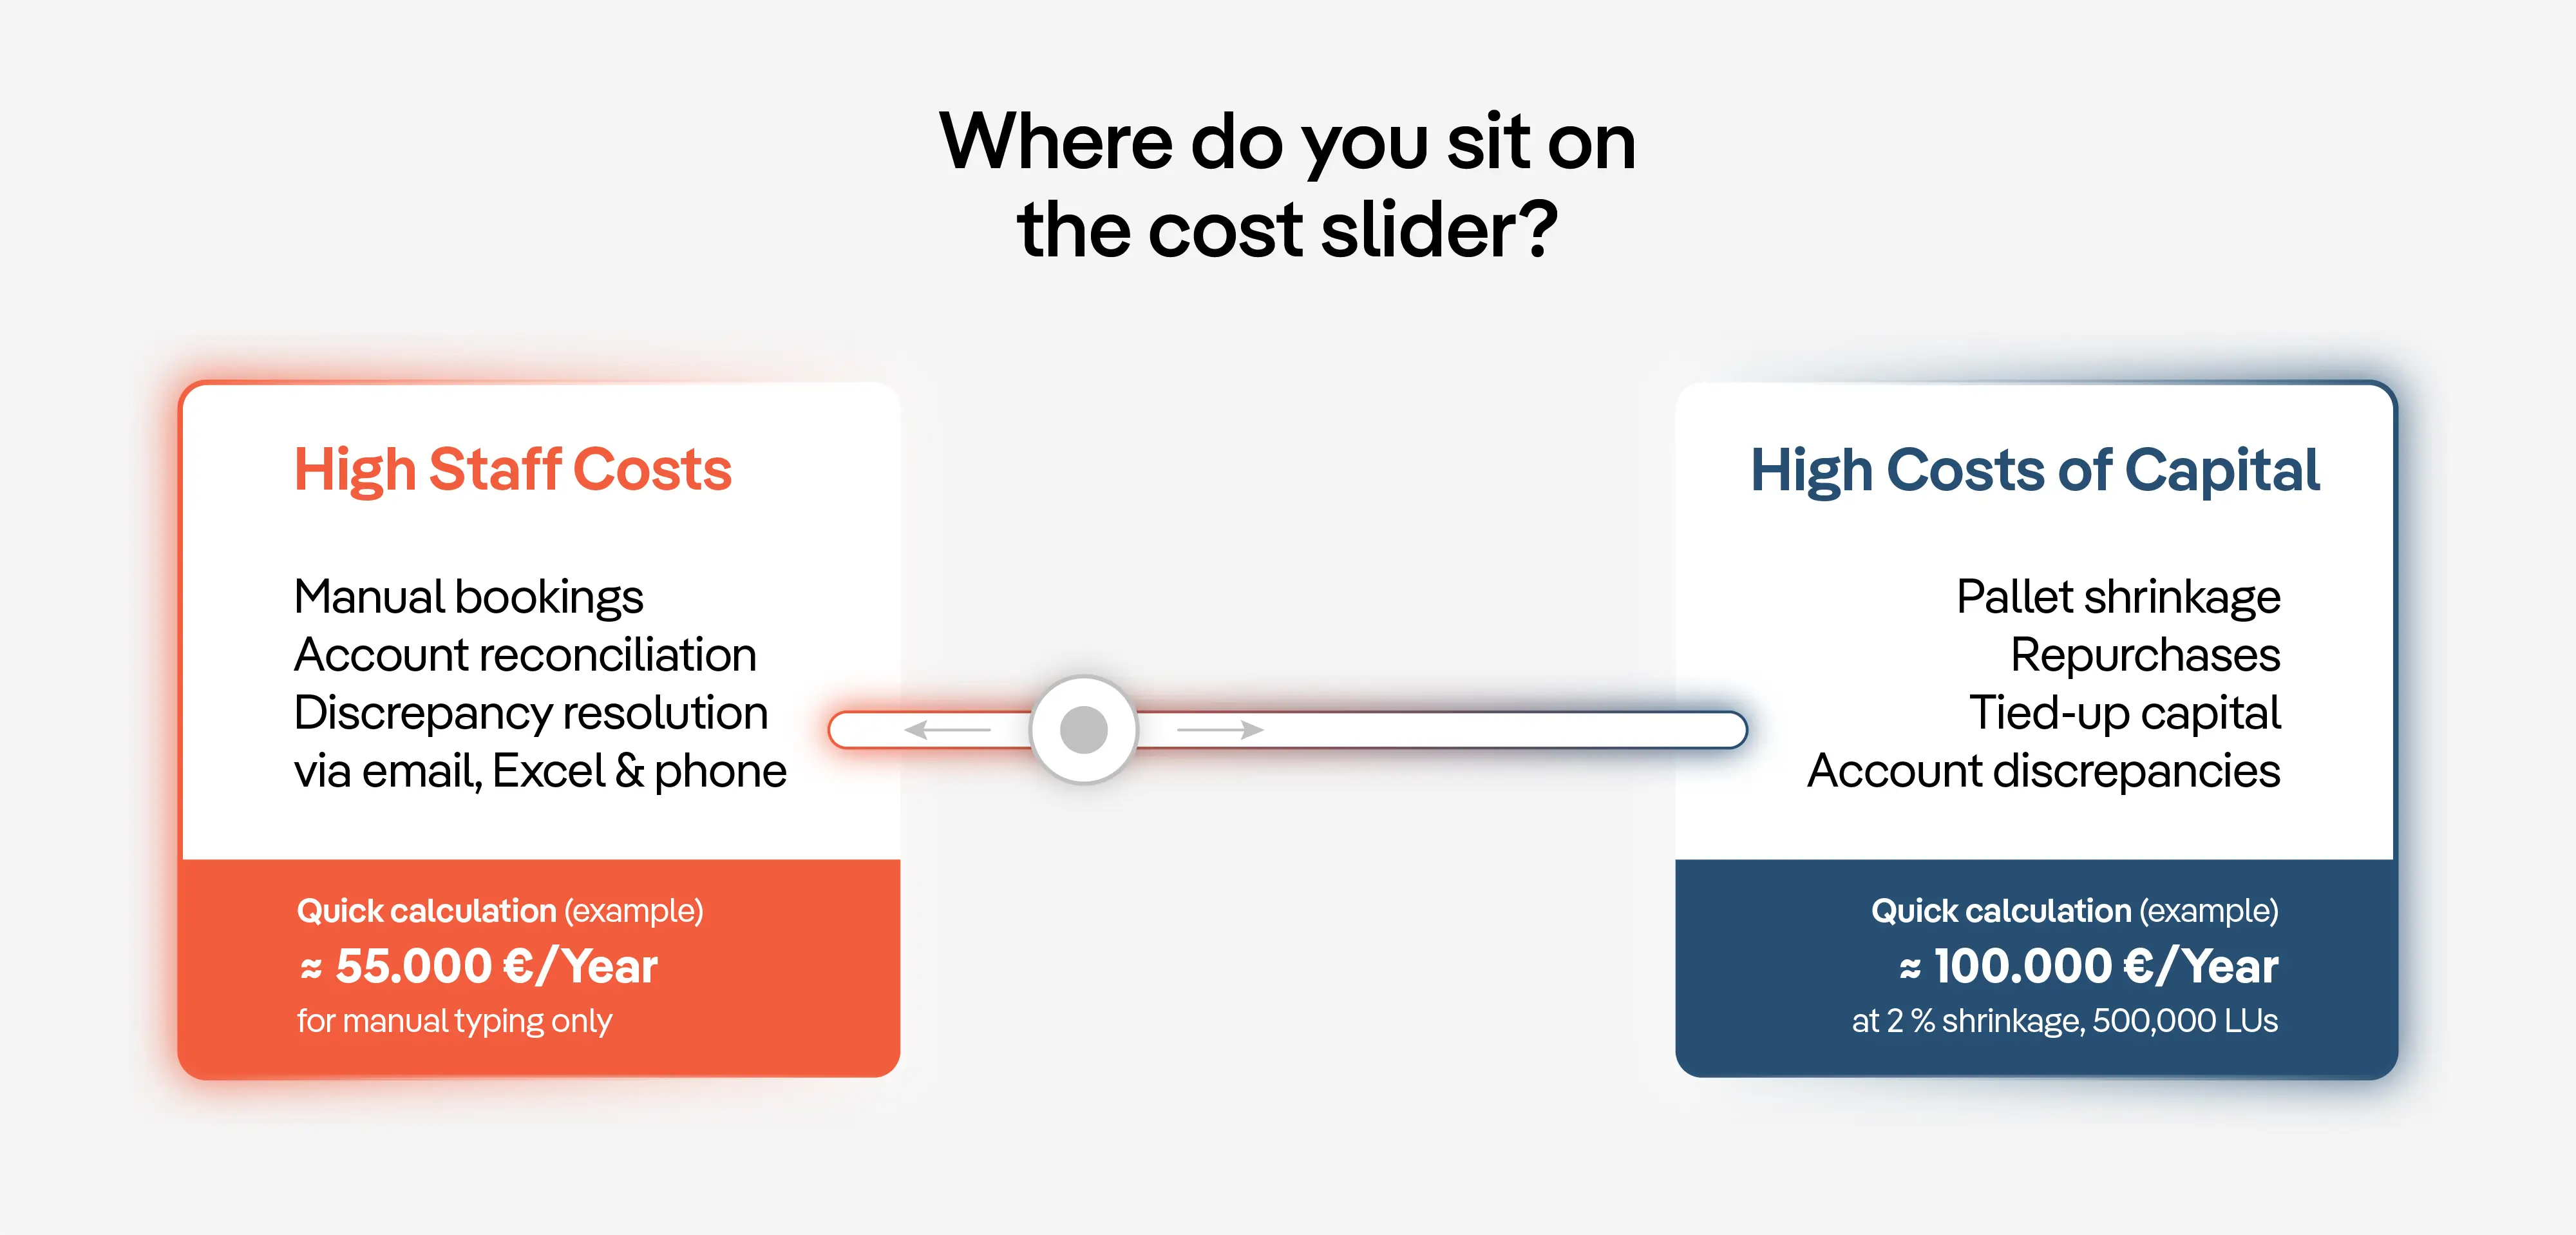
Left or right: where do you stand on the cost spectrum?
Imagine a sliding scale. On the left are companies that mainly invest time in keeping track of things. On the right are companies that prefer to restock rather than keep stock.
Left-hand side: High staff costs.
Here, load carrier management involves a big amount of manual work. Transactions are entered manually. Accounts are reconciled regularly – but via Excel, email and telephone. Several staff members spend a large part of their working hours tracking pallets, resolving discrepancies and compiling documentation.
That sounds like control. But it often isn’t – because the more manual steps there are, the more opportunities there are for error. And the higher the staffing costs, which by the end of the year can be measured in full-time equivalent positions that could actually be put to better use.
Quick calculation: 500 receipts per day × 40 seconds × 250 working days × €40/hour = around €55,000 for data entry alone. Not yet included: account reconciliation, requests, and resolving discrepancies.
Right-hand side: High cost of capital.
Here, there’s less focus on documentation; instead, they prefer to simply buy more. Short on pallets? Order some new ones. A discrepancy in the accounts? Sort it out somehow. The main thing is that the business keeps running.
That sounds pragmatic. But it’s a costly approach. Because what isn’t recorded disappears. And what disappears will eventually have to be replaced – often without it being clear who is actually responsible for doing so.
Quick calculation: With a shrinkage rate of just 2% and 500,000 units in annual circulation, each worth €10, €100,000 is missing at the end of the year. Added to this is capital that is unnecessarily tied up in circulation.
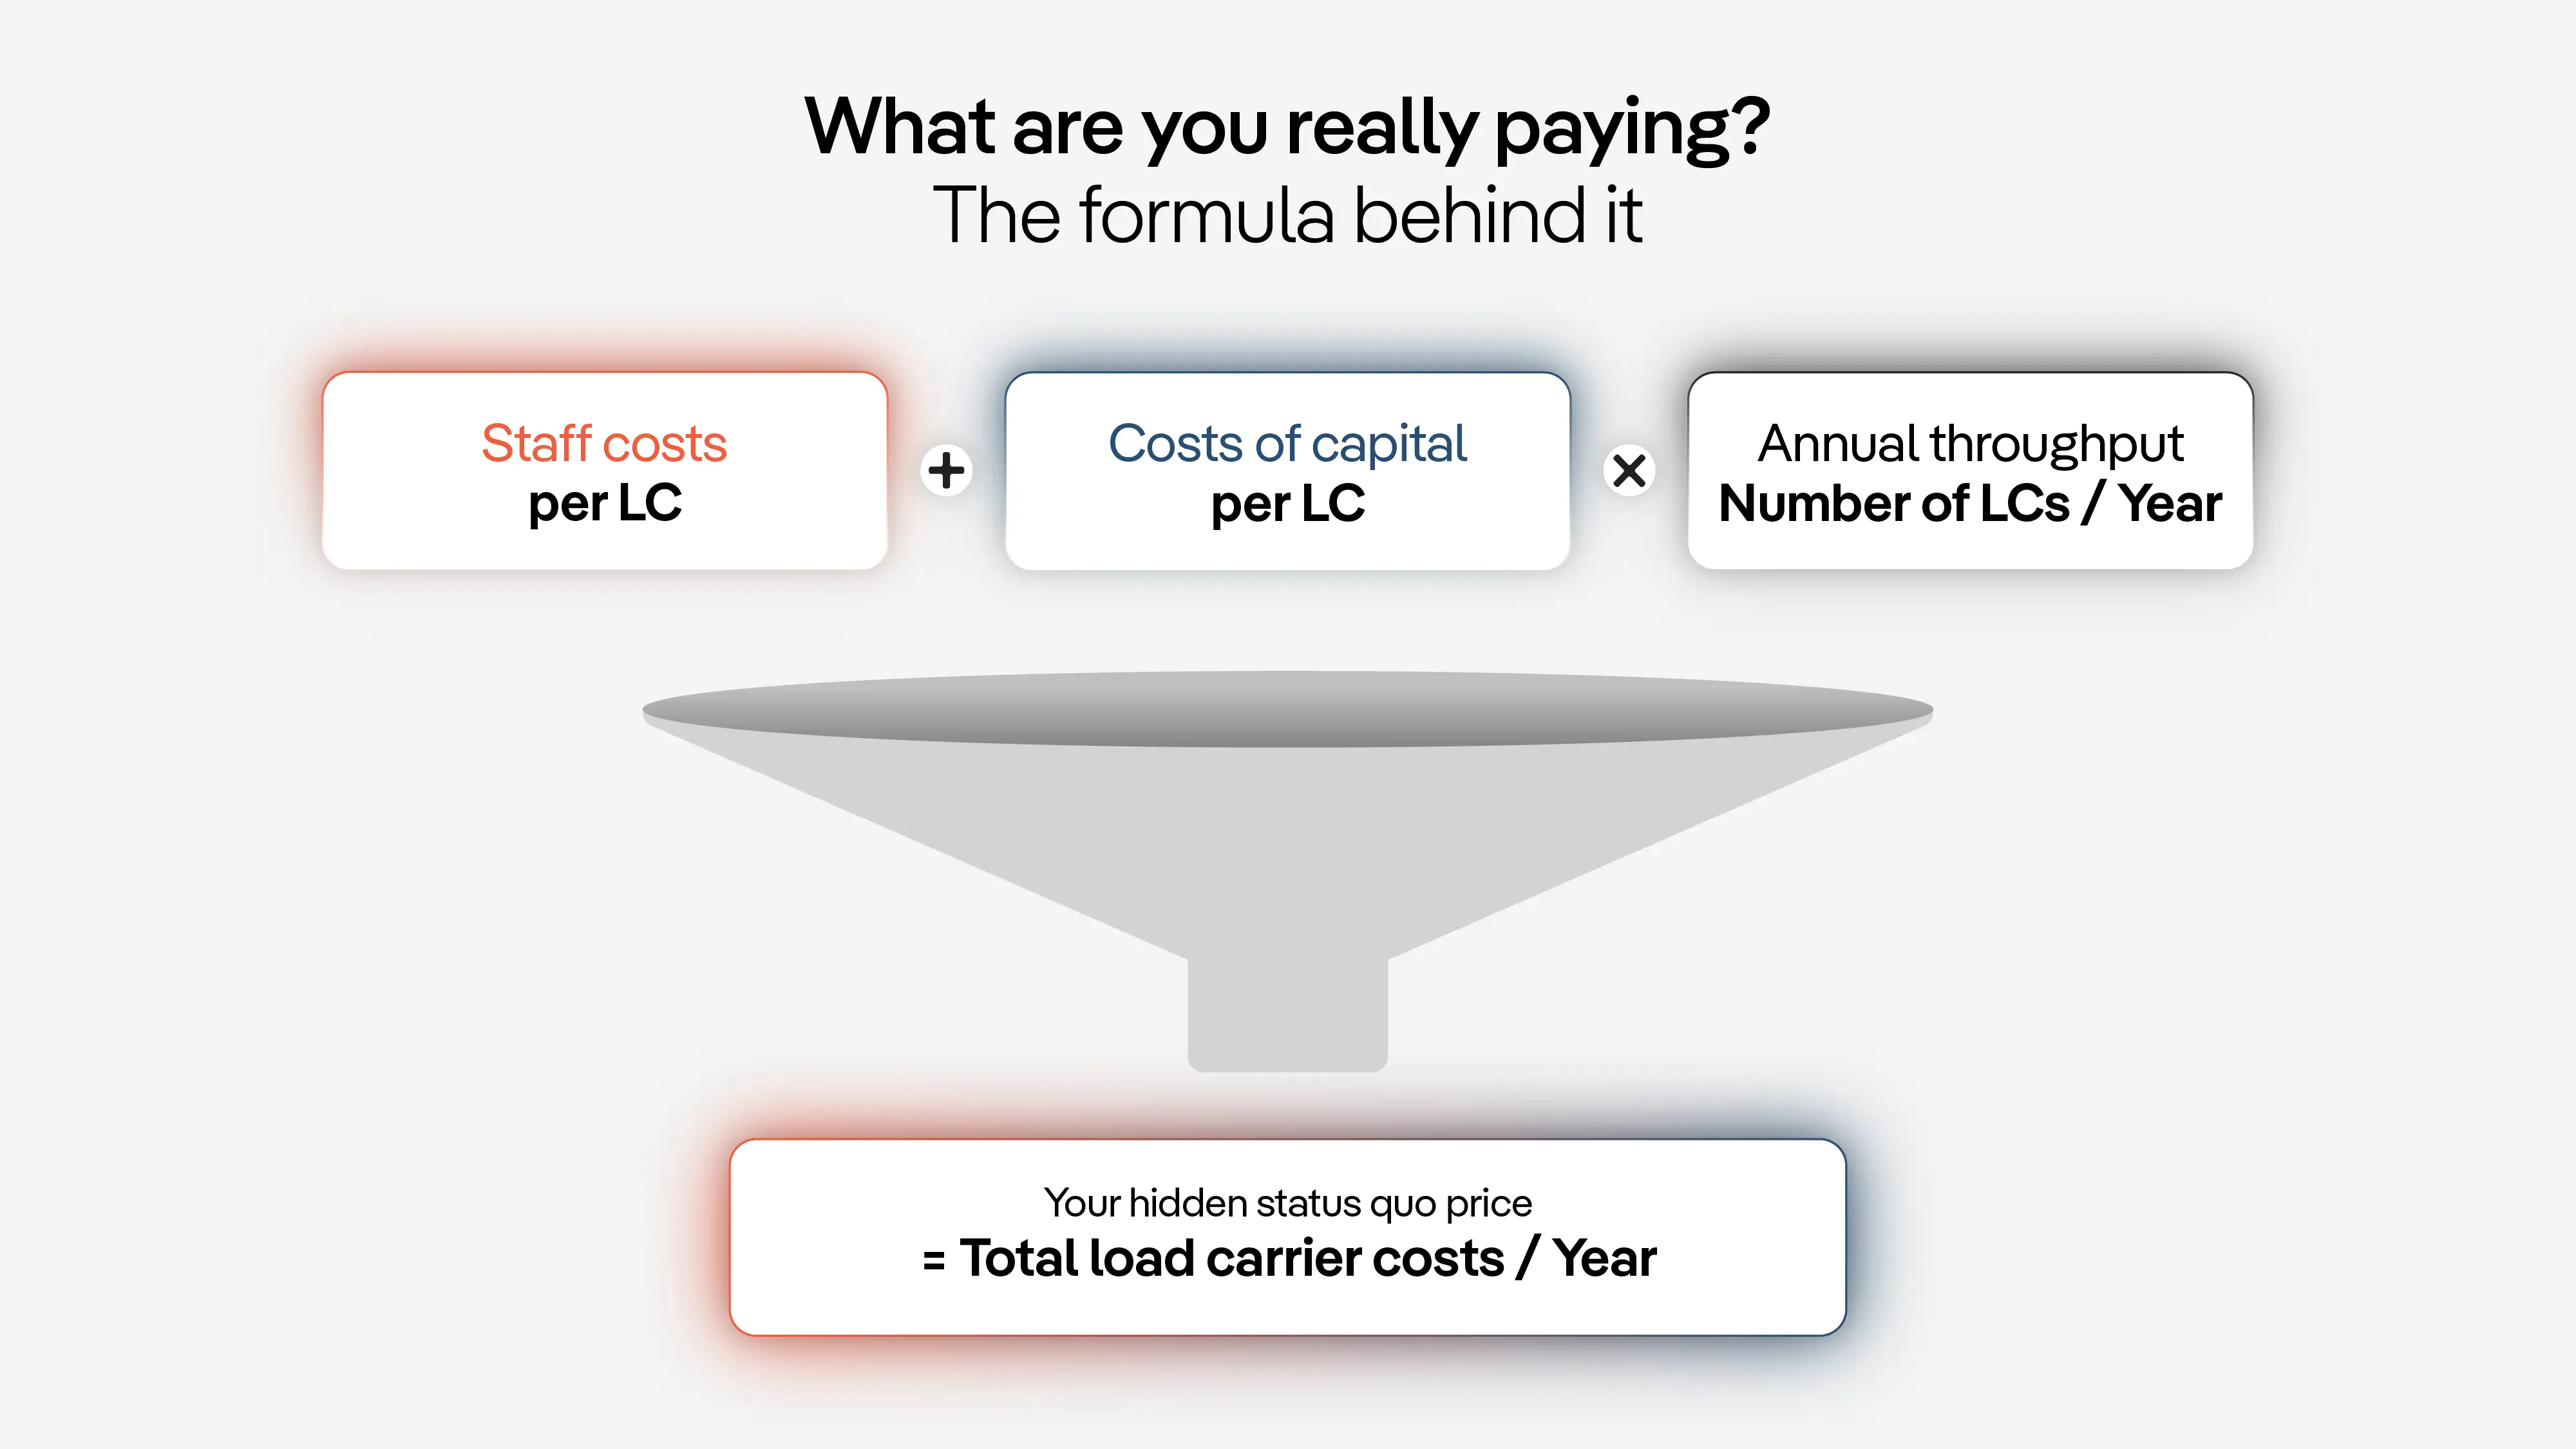
The real question is: what are you actually paying?
Very few companies know their actual costs – because these two areas are rarely considered together. Staff costs are hidden away in timesheets and job descriptions. Capital costs appear as re-purchases or stock discrepancies, but are rarely directly attributed to pallet management.
The calculation is actually quite simple:
(Labour costs per unit + capital costs per unit) × annual throughput = your current price
What many people underestimate is that even small improvements in both areas – less time spent on manual booking, slightly lower wastage – can add up to thousands of euros a year. For larger volumes, the impact is significantly higher.
What a digital system actually changes
A centralised load carrier management system tackles both aspects head-on:
✔ Staff costs are falling, because manual entries are automated, reconciliations are carried out via a web link, and queries are minimised thanks to comprehensive documentation.
✔ The cost of capital is falling, because stock losses are immediately apparent, stock discrepancies are automatically detected and restocking is kept to a minimum.
The result: less effort required on the left side of the slider, fewer silent losses on the right.
Work it out for yourself in 2 minutes
You don’t need to guess. We have a free calculator that does exactly that: simply enter your pallet throughput, the number of business partners, the wastage rate and the repair rate – and you’ll immediately see what your current staffing and capital costs are, and where the greatest potential for savings lies.
The result is broken down directly into two categories: potential savings on staff costs and potential savings on capital expenditure. This allows you to see straight away which side of the cost slider you’re on – and where it’s worth starting first.
